Blogs related to Foyle.
This is the multi-page printable view of this section. Click here to print.
Blog
- The Unreasonable Effectiveness of Human Feedback
- Without a copilot for devops we won't keep up
- Logging Implicit Human Feedback
The Unreasonable Effectiveness of Human Feedback
This post presents quantitative results showing how human feedback allows Foyle to assist with building and operating Foyle. In 79% of cases, Foyle provided the correct answer, whereas ChatGPT alone would lack sufficient context to achieve the intent. Furthermore, the LLM API calls cost less than $.002 per intent whereas a recursive, agentic approach could easily cost $2-$10.
Agents! Agents! Agents! Everywhere we look we are bombarded with the promises of fully autonomous agents. These pesky humans aren’t merely inconveniences, they are budgetary line items to be optimized away. All this hype leaves me wondering; have we forgotten that GPT was fine-tuned using data produced by a small army of human labelers? Not to mention who do we think produced the 10 trillion words that foundation models are being trained on? While fully autonomous software agents are capturing the limelight on social media, systems that turn user interactions into training data like Didact, Dosu and Replit code repair are deployed and solving real toil.
Foyle takes a user-centered approach to building an AI to help developers deploy and operate their software. The key premise of Foyle is to instrument a developer’s workflow so that we can monitor how they turn intent into actions. Foyle uses that interaction data to constantly improve. A previous post described how Foyle uses this data to learn. This post presents quantitative results showing how feedback allows Foyle to assist with building and operating Foyle. In 79% of cases, Foyle provided the correct answer, whereas ChatGPT alone would lack sufficient context to achieve the intent. In particular, the results show how Foyle lets users express intent at a higher level of abstraction.
As a thought experiment, we can compare Foyle against an agentic approach that achieves the same accuracy by recursively invoking an LLM on Foyle’s (& RunMe’s) 65K lines of code but without the benefit of learning from user interactions. In this case, we estimate that Foyle could easily save between $2-$10 on LLM API calls per intent. In practice, this likely means learning from prior interactions is critical to making an affordable AI.
Mapping Intent Into Action
The pain of deploying and operating software was famously captured in a 2010 Meme at Google “I just want to serve 5 Tb”. The meme captured that simple objectives (e.g. serving some data) can turn into a bewildering complicated tree of operations due to system complexity and business requirements. The goal of Foyle is to solve this problem of translating intent into actions.
Since we are using Foyle to build Foyle, we can evaluate it by how well it learns to assist us with everyday tasks. The video below illustrates how we use Foyle to troubleshoot the AI we are building by fetching traces.
The diagram below illustrates how Foyle works.

In the video, we are using Foyle to fetch the trace for a specific prediction. This is a fundamental step in any AI Engineer’s workflow. The trace contains the information needed to understand the AI’s answer; e.g. the prompts to the LLMs, the result of post-processing etc… Foyle takes the markdown produced by ChatGPT and turns it into a set of blocks and assigns each block a unique ID. So to understand why a particular block was generated we might ask for the block trace as follows
show the block logs for block 01HZ3K97HMF590J823F10RJZ4T
The first time we ask Foyle to help us it has no prior interactions to learn from so it largely passes along the request to ChatGPT and we get the following response
blockchain-cli show-block-logs 01HZ3K97HMF590J823F10RJZ4T
Unsurprisingly, this is completely wrong because ChatGPT has no knowledge of Foyle; its just guessing. The first time we ask for a trace, we would fix the command to use Foyle’s REST endpoint to fetch the logs
curl http://localhost:8080/api/blocklogs/01HZ3K97HMF590J823F10RJZ4T | jq .
Since Foyle is instrumented to log user interactions it learns from this interaction. So the next time we ask for a trace e.g.
get the log for block 01HZ0N1ZZ8NJ7PSRYB6WEMH08M
Foyle responds with the correct answer
curl http://localhost:8080/api/blocklogs/01HZ0N1ZZ8NJ7PSRYB6WEMH08M | jq .
Notably, this example illustrates that Foyle is learning how to map higher level concepts (e.g. block logs) into low level concrete actions (e.g. curl).
Results
To measure Foyle’s ability to learn and assist with mapping intent into action, we created an evaluation dataset of 24 examples of intents specific to building and operating Foyle. The dataset consists of the following
- Evaluation Data: 24 pairs of (intent, action) where the action is a command that correctly achieves the intent
- Training Data: 27 pairs of (intent, action) representing user interactions logged by Foyle
- These were the result of our daily use of Foyle to build Foyle
To evaluate the effectiveness of human feedback we compared using GPT3.5 without examples to GPT3.5 with examples. Using examples, we prompt GPT3.5 with similar examples from prior usage(the prompt is here). Prior examples are selected by using similarity search to find the intents most similar to the current one. To measure the correctness of the generated commands we use a version of edit distance that measures the number of arguments that need to be changed. The binary itself counts as an argument. This metric can be normalized so that 0 means the predicted command is an exact match and 1 means the predicted command is completely different (precise details are here).
The Table 1. below shows that Foyle performs significantly better when using prior examples. The full results are in the appendix. Notably, in 15 of the examples where using ChatGPT without examples was wrong it was completely wrong. This isn’t at all surprising given GPT3.5 is missing critical information to answer these questions.
| Number of Examples | Percentage | |
| Performed Better With Examples | 19 | 79% |
| Did Better or Just As Good With Examples | 22 | 91% |
| Did Worse With Examples | 2 | 8% |
Table 1: Shows that for 19 of the examples (79%); the AI performed better when learning from prior examples. In 22 of the 24 examples (91%) using the prior examples the AI did no worse than baseline. In 2 cases, using prior examples decreased the AI’s performance. The full results are provided in the table below.
Distance Metric
Our distance metrics assumes there are specific tools that should be used to accomplish a task even when different solutions might produce identical answers. In the context of devops this is desirable because there is a cost to supporting a tool; e.g. ensuring it is available on all machines. As a result, platform teams are often opinionated about how things should be done.
For example to fetch the block logs for block 01HZ0N1ZZ8NJ7PSRYB6WEMH08M we measure the distance to the command
curl http://localhost:8080/api/blocklogs/01HZ0N1ZZ8NJ7PSRYB6WEMH08M | jq .
Using our metric if the AI answered
wget -q -O - http://localhost:8080/api/blocklogs/01HZ0N1ZZ8NJ7PSRYB6WEMH08M | yq .
The distance would end up being .625. The longest command consists of 8 arguments (including the binaries and the pipe operator). 3 deletions and 2 substitutions are needed to transform the actual into the expected answer which yields a distance of ⅝=.625. So in this case, we’d conclude the AI’s answer was largely wrong even though wget produces the exact same output as curl in this case. If an organization is standardizing on curl over wget then the evaluation metric is capturing that preference.
How much is good data worth?
A lot of agents appear to be pursuing a solution based on throwing lots of data and lots of compute at the problem. For example, to figure out how to “Get the log for block XYZ”, an agent could in principle crawl the Foyle and RunMe repositories to understand what a block is and that Foyle exposes a REST server to make them accessible. That approach might cost $2-$10 in LLM calls whereas with Foyle it’s less than $.002.
The Foyle repository is ~400K characters of Go Code; the RunMe Go code base is ~1.5M characters. So lets say 2M characters which is about 500K-1M tokens. With GPT-4-turbo that’s ~$2-$10; or about 1-7 SWE minutes (assuming $90 per hour). If the Agent needs to call GPT4 multiple times those costs are going to add up pretty quickly.
Where is Foyle Going
Today, Foyle is only learning single step workflows. While this is valuable, a lot of a toil involves multi step workflows. We’d like to extend Foyle to support this use case. This likely requires changes to how Foyle learns and how we evaluate Foyle.
Foyle only works if we log user interactions. This means we need to create a UX that is compelling enough for developers to want to use. Foyle is now integrated with Runme. We want to work with the Runme team to create features (e.g. Renderers, multiple executor support) that give users a reason to adopt a new tool even without AI.
How You Can Help
If you’re rethinking how you do playbooks and want to create AI assisted executable playbooks please get in touch via email jeremy@lewi.us or by starting a discussion in GitHub. In particular, if you’re struggling with observability and want to use AI to assist in query creation and create rich artifacts combining markdown, commands, and rich visualizations, we’d love to learn more about your use case.
Appendix: Full Results
The table below provides the prompts, RAG results, and distances for the entire evaluation dataset.
| prompt | best_rag | Baseline Normalized | Learned Distance |
| Get the ids of the execution traces for block 01HZ0W9X2XF914XMG6REX1WVWG | get the ids of the execution traces for block 01HZ3K97HMF590J823F10RJZ4T | 0.6666667 | 0 |
| Fetch the replicate API token | Show the replicate key | 1 | 0 |
| List the GCB jobs that build image backend/caribou | list the GCB builds for commit 48434d2 | 0.5714286 | 0.2857143 |
| Get the log for block 01HZ0N1ZZ8NJ7PSRYB6WEMH08M | show the blocklogs for block 01HZ3K97HMF590J823F10RJZ4T ... | 1 | 0 |
| How big is foyle's evaluation data set? | Print the size of foyle's evaluation dataset | 1 | 0 |
| List the most recent image builds | List the builds | 1 | 0.5714286 |
| Run foyle training | Run foyle training | 0.6666667 | 0.6 |
| Show any drift in the dev infrastructure | show a diff of the dev infra | 1 | 0.4 |
| List images | List the builds | 0.75 | 0.75 |
| Get the cloud build jobs for commit abc1234 | list the GCB builds for commit 48434d2 | 0.625 | 0.14285715 |
| Push the honeycomb nl to query model to replicate | Push the model honeycomb to the jlewi repository | 1 | 0.33333334 |
| Sync the dev infra | show a diff of the dev infra | 1 | 0.5833333 |
| Get the trace that generated block 01HZ0W9X2XF914XMG6REX1WVWG | get the ids of the execution traces for block 01HZ3K97HMF590J823F10RJZ4T | 1 | 0 |
| How many characters are in the foyle codebase? | Print the size of foyle's evaluation dataset | 1 | 0.875 |
| Add the tag 6f19eac45ccb88cc176776ea79411f834a12a575 to the image ghcr.io/jlewi/vscode-web-assets:v20240403t185418 | add the tag v0-2-0 to the image ghcr.io/vscode/someimage:v20240403t185418 | 0.5 | 0 |
| Get the logs for building the image carabou | List the builds | 1 | 0.875 |
| Create a PR description | show a diff of the dev infra | 1 | 1 |
| Describe the dev cluster? | show the dev cluster | 1 | 0 |
| Start foyle | Run foyle | 1 | 0 |
| Check for preemptible A100 quota in us-central1 | show a diff of the dev infra | 0.16666667 | 0.71428573 |
| Generate a honeycomb query to count the number of traces for the last 7 days broken down by region in the foyle dataset | Generate a honeycomb query to get number of errors per day for the last 28 days | 0.68421054 | 0.8235294 |
| Dump the istio routes for the pod jupyter in namespace kubeflow | list the istio ingress routes for the pod foo in namespace bar | 0.5 | 0 |
| Sync the manifests to the dev cluster | Use gitops to aply the latest manifests to the dev cluster | 1 | 0 |
| Check the runme logs for an execution for the block 01HYZXS2Q5XYX7P3PT1KH5Q881 | get the ids of the execution traces for block 01HZ3K97HMF590J823F10RJZ4T | 1 | 1 |
Table 2. The full results for the evaluation dataset. The left column shows the evaluation prompt. The second column shows the most similar prior example (only the query is shown). The third column is the normalized distance for the baseline AI. The 4th column is the normalized distance when learning from prior examples.
Without a copilot for devops we won't keep up
Foyle is an open source assistant to help software developers deal with the pain of devops. One of Foyle’s central premises is that creating a UX that implicitly captures human feedback is critical to building AIs that effectively assist us with operations. This post describes how Foyle logs that feedback.
Since co-pilot launched in 2021, AI accelerated software development has become the norm. More importantly, as Simon Willison argued at last year’s AI Engineer Summit with AI there has never been an easier time to learn to code. This means the population of people writing code is set to explode. All of this begs the question, who is going to operate all this software? While writing code is getting easier, our infrastructure is becoming more complex and harder to understand. Perhaps we shouldn’t be surprised that as the cost of writing software decreases, we see an explosion in the number of tools and abstractions increasing complexity; the expanding CNCF landscape is a great illustration of this.
The only way to keep up with AI assisted coding is with AI assisted operations. While we are being flooded with copilots and autopilots for writing software, there has been much less progress with assistants for operations. This is because 1) everyone’s infrastructure is different; an outcome of the combinatorial complexity of today’s options and 2) there is no single system with a complete and up to date picture of a company’s infrastructure.
Consider a problem that has bedeviled me ever since I started working on Kubeflow; “I just want to deploy Jupyter on my company’s Cloud and access it securely.” To begin to ask AIs (ChatGPT, Claude, Bard) for help we need to teach them about our infrastructure; e.g. What do we use for compute, ECS, GKE, GCE? What are we using for VPN; tailscale, IAP, Cognito? How do we attach credentials to Jupyter so we can access internal data stores? What should we do for storage; Persistent disk or File store?
The fundamental problem is mapping a user’s intent, “deploy Jupyter”, to the specific set of operations to achieve that within our organization. The current solution is to build platforms that create higher level abstractions that hopefully more closely map to user intent while hiding implementation details. Unfortunately, building platforms is expensive and time consuming. I have talked to organizations with 100s of engineers building an internal developer platform (IDP).
Foyle is an OSS project that aims to simplify software operations with AI. Foyle uses notebooks to create a UX that encourages developers to express intent as well as actions. By logging this data, Foyle is able to build models that predict the operations needed to achieve a given intent. This is a problem which LLMs are unquestionably good at.
Demo
Let’s consider one of the most basic operations; fetching the logs to understand why something isn’t working. Observability is critical but at least for me a constant headache. Each observability tool has their own hard to remember query language and queries depend on how applications were instrumented. As an example, Hydros is a tool I built for CICD. To figure out whether hydros successfully built an image or hydrated some manifests I need to query its logs.
A convenient and easy way for me to express my intent is with the query
fetch the hydros logs for the image vscode-ext
If we send this to an AI (e.g. ChatGPT) with no knowledge of our infrastructure we get an answer which is completely wrong.
hydros logs vscode-ext
This is a good guess but wrong because my logs are stored in Google Cloud Logging. The correct query executed using gcloud is the following.
gcloud logging read 'logName="projects/foyle-dev/logs/hydros" jsonPayload.image="vscode-ext"' --freshness=1d --project=foyle-dev
Now the very first time I access hydros logs I’m going to have to help Foyle understand that I’m using Cloud Logging and how hydros structures its logs; i.e. that each log entry contains a field image with the name of the image being logged. However, since Foyle logs the intent and final action it is able to learn. The next time I need to access logs if I issue a query like
show the hydros logs for the image caribou
Foyle responds with the correct query
gcloud logging read 'logName="projects/foyle-dev/logs/hydros" jsonPayload.image="caribou"' --freshness=1d --project=foyle-dev
I have intentionally asked for an image that doesn’t exist because I wanted to test whether Foyle is able to learn the correct pattern as opposed to simply memorizing commands. Using a single example Foyle learns 1) what log is used by hydros and 2) how hydros uses structured logging to associate log messages with a particular image. This is possible because foundation models already have significant knowledge of relevant systems (i.e. gcloud and Cloud Logging).
Foyle relies on a UX which prioritizes collecting implicit feedback to teach the AI about our infrastructure.

In this interaction, a user asks an AI to translate their intent into one or more tools the user can invoke. The tools are rendered in executable, editable cells inside the notebook. This experience allows the user to iterate on the commands if necessary to arrive at the correct answer. Foyle logs these iterations (see this previous blog post for a detailed discussion) so it can learn from them.
The learning mechanism is quite simple. As denoted above we have the original query, Q, the initial answer from the AI, A, and then the final command, A’, the user executed. This gives us a triplet (Q, A, A’). If A=A’ the AI got the answer right; otherwise the AI made a mistake the user had to fix.
The AI can easily learn from its mistakes by storing the pairs (Q, A’). Given a new query Q* we can easily search for similar queries from the past where the AI made a mistake. Matching text based on semantic similarity is one of the problems LLMs excel at. Using LLMs we can compute the embedding of Q and Q* and measure the similarity to find similar queries from the past. Given a set of similar examples from the past {(Q1,A1’),(Q2,A2’),…,(Qn,An’)} we can use few shot prompting to get the LLM to learn from those past examples and answer the new query correctly. As demonstrated by the example above this works quite well.
This pattern of collecting implicit human feedback and learning from it is becoming increasingly common. Dosu uses this pattern to build AIs that can automatically label issues.
An IDE For DevOps
One of the biggest barriers to building copilots for devops is that when it comes to operating infrastructure we are constantly switching between different modalities
- We use IDEs/Editors to edit our IAC configs
- We use terminals to invoke CLIs
- We use UIs for click ops and visualization
- We use tickets/docs to capture intent and analysis
- We use proprietary web apps to get help from AIs
This fragmented experience for operations is a barrier to collecting data that would let us train powerful assistants. Compare this to writing software where a developer can use a single IDE to write, build, and test their software. When these systems are well instrumented you can train really valuable software assistants like Google’s DIDACT and Replit Code Repair.
This is an opportunity to create a better experience for devops even in the absence of AI. A great example of this is what the Runme.dev project is doing. Below is a screenshot of a Runme.dev interactive widget for VMs rendered directly in the notebook.
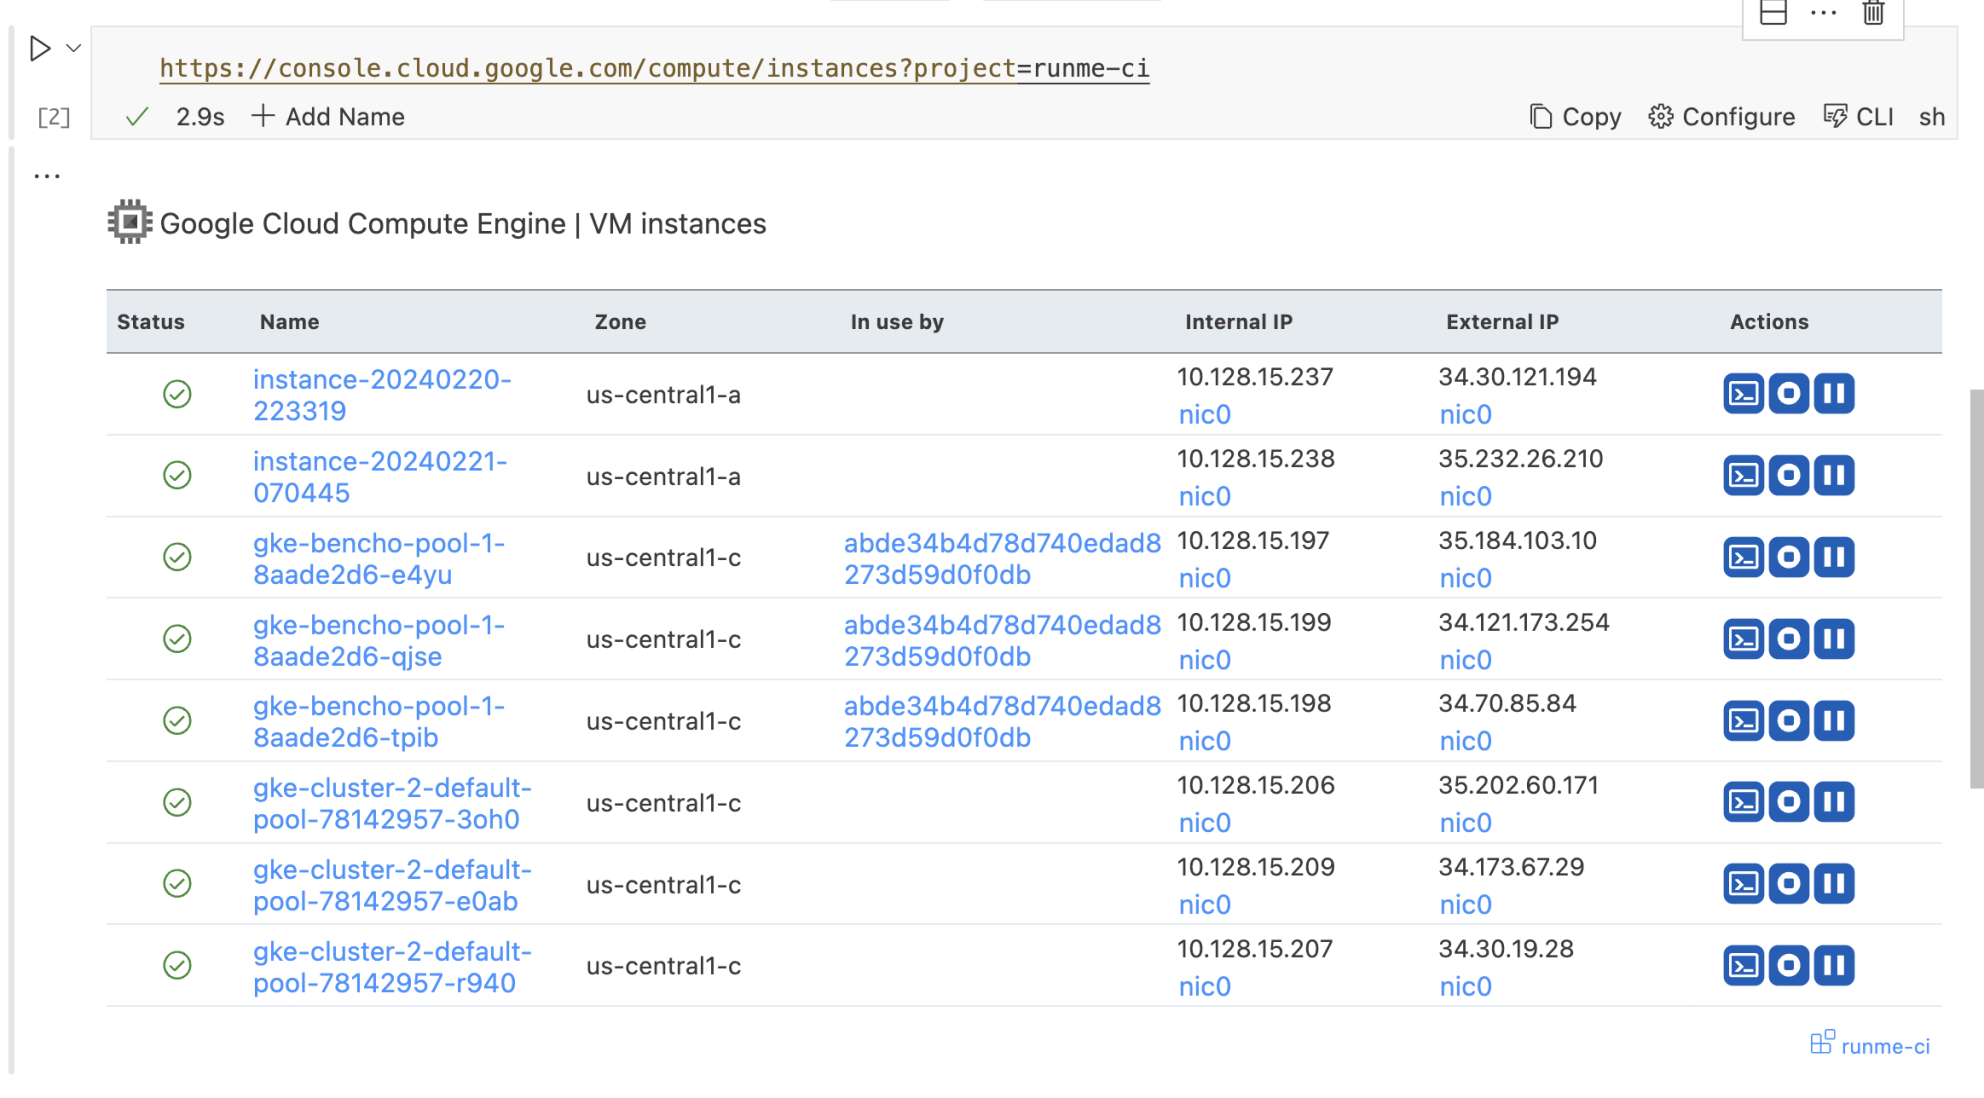
This illustrates a UX where users don’t need to choose between the convenience of ClickOps and being able to log intent and action. Another great example is Datadog Notebooks. When I was at Primer, I found using Datadog notebooks to troubleshoot and document issues was far superior to copying and pasting links and images into tickets or Google Docs.
Conclusion: Leading the AI Wave
If you’re a platform engineer like me you’ve probably spent previous waves of AI building tools to support AI builders; e.g. by exposing GPUs or deploying critical applications like Jupyter. Now we, platform engineers, are in a position to use AI to solve our own problems and better serve our customers. Despite all the excitement about AI, there’s a shortage of examples of AI positively transforming how we work. Let’s make platform engineering a success story for AI.
Acknowledgements
I really appreciate Hamel Husain reviewing and editing this post.
Logging Implicit Human Feedback
Foyle is an open source assistant to help software developers deal with the pain of devops. One of Foyle’s central premises is that creating a UX that implicitly captures human feedback is critical to building AIs that effectively assist us with operations. This post describes how Foyle logs that feedback.
Foyle is an open source assistant to help software developers deal with the pain of devops. Developers are expected to operate their software which means dealing with the complexity of Cloud. Foyle aims to simplify operations with AI. One of Foyle’s central premises is that creating a UX that implicitly captures human feedback is critical to building AIs that effectively assist us with operations. This post describes how Foyle logs that feedback.
The Problem
As software developers, we all ask AIs (ChatGPT, Claude, Bard, Ollama, etc.…) to write commands to perform operations. These AIs often make mistakes. This is especially true when the correct answer depends on internal knowledge, which the AI doesn’t have.
- What region, cluster, or namespace is used for dev vs. prod?
- What resources is the internal code name “caribou” referring to?
- What logging schema is used by our internal CICD tool?
The experience today is
- Ask an assistant for one or more commands
- Copy those commands to a terminal
- Iterate on those commands until they are correct
When it comes to building better AIs, the human feedback provided by the last step is gold. Yet today’s UX doesn’t allow us to capture this feedback easily. At best, this feedback is often collected out of band as part of a data curation step. This is problematic for two reasons. First, it’s more expensive because it requires paying for labels (in time or money). Second, if we’re dealing with complex, bespoke internal systems, it can be hard to find people with the requisite expertise.
Frontend
If we want to collect human feedback, we need to create a single unified experience for
- Asking the AI for help
- Editing/Executing AI suggested operations
If users are copying and pasting between two different applications the likelihood of being able to instrument it to collect feedback goes way down. Fortunately, we already have a well-adopted and familiar pattern for combining exposition, commands/code, and rich output. Its notebooks.
Foyle’s frontend is VSCode notebooks. In Foyle, when you ask an AI for assistance, the output is rendered as cells in the notebook. The cells contain shell commands that can then be used to execute those commands either locally or remotely using the notebook controller API, which talks to a Foyle server. Here’s a short video illustrating the key interactions.
Crucially, cells are central to how Foyle creates a UX that automatically collects human feedback. When the AI generates a cell, it attaches a UUID to that cell. That UUID links the cell to a trace that captures all the processing the AI did to generate it (e.g any LLM calls, RAG calls, etc…). In VSCode, we can use cell metadata to track the UUID associated with a cell.
When a user executes a cell, the frontend sends the contents of the cell along with its UUID to the Foyle server. The UUID then links the cell to a trace of its execution. The cell’s UUID can be used to join the trace of how the AI generated the cell with a trace of what the user actually executed. By comparing the two we can easily see if the user made any corrections to what the AI suggested.

Traces
Capturing traces of the AI and execution are essential to logging human feedback. Foyle is designed to run on your infrastructure (whether locally or in your Cloud). Therefore, it’s critical that Foyle not be too opinionated about how traces are logged. Fortunately, this is a well-solved problem. The standard pattern is:
- Instrument the app using structured logs
- App emits logs to stdout and stderr
- When deploying the app collect stdout and stderr and ship them to whatever backend you want to use (e.g. Google Cloud Logging, Datadog, Splunk etc…)
When running locally, setting up an agent to collect logs can be annoying, so Foyle has the built-in ability to log to files. We are currently evaluating the need to add direct support for other backends like Cloud Logging. This should only matter when running locally because if you’re deploying on Cloud chances are your infrastructure is already instrumented to collect stdout and stderr and ship them to your backend of choice.
Don’t reinvent logging
Using existing logging libraries that support structured logging seems so obvious to me that it hardly seems worth mentioning. Except, within the AI Engineering/LLMOps community, it’s not clear to me that people are reusing existing libraries and patterns. Notably, I’m seeing a new class of observability solutions that require you to instrument your code with their SDK. I think this is undesirable as it violates the separation of concerns between how an application is instrumented and how that telemetry is stored, processed, and rendered. My current opinion is that Agent/LLM observability can often be achieved by reusing existing logging patterns. So, in defense of that view, here’s the solution I’ve opted for.
Structured logging means that each log line is a JSON record which can contain arbitrary fields. To Capture LLM or RAG requests and responses, I log them; e.g.
request := openai.ChatCompletionRequest{
			Model:       a.config.GetModel(),
			Messages:    messages,
			MaxTokens:   2000,
			Temperature: temperature,
	    }

log.Info("OpenAI:CreateChatCompletion", "request", request)
This ends up logging the request in JSON format. Here’s an example
{
  "severity": "info",
  "time": 1713818994.8880482,
  "caller": "agent/agent.go:132",
  "function": "github.com/jlewi/foyle/app/pkg/agent.(*Agent).completeWithRetries",
  "message": "OpenAI:CreateChatCompletion response",
  "traceId": "36eb348d00d373e40552600565fccd03",
  "resp": {
    "id": "chatcmpl-9GutlxUSClFaksqjtOg0StpGe9mqu",
    "object": "chat.completion",
    "created": 1713818993,
    "model": "gpt-3.5-turbo-0125",
    "choices": [
      {
        "index": 0,
        "message": {
          "role": "assistant",
          "content": "To list all the images in Artifact Registry using `gcloud`, you can use the following command:\n\n```bash\ngcloud artifacts repositories list --location=LOCATION\n```\n\nReplace `LOCATION` with the location of your Artifact Registry. For example, if your Artifact Registry is in the `us-central1` location, you would run:\n\n```bash\ngcloud artifacts repositories list --location=us-central1\n```"
        },
        "finish_reason": "stop"
      }
    ],
    "usage": {
      "prompt_tokens": 329,
      "completion_tokens": 84,
      "total_tokens": 413
    },
    "system_fingerprint": "fp_c2295e73ad"
  }
}
A single request can generate multiple log entries. To group all the log entries related to a particular request, I attach a trace id to each log message.
func (a *Agent) Generate(ctx context.Context, req *v1alpha1.GenerateRequest) (*v1alpha1.GenerateResponse, error) {
   span := trace.SpanFromContext(ctx)
   log := logs.FromContext(ctx)
   log = log.WithValues("traceId", span.SpanContext().TraceID())
Since I’ve instrumented Foyle with open telemetry(OTEL), each request is automatically assigned a trace id. I attach that trace id to all the log entries associated with that request. Using the trace id assigned by OTEL means I can link the logs with the open telemetry trace data.
OTEL is an open standard for distributed tracing. I find OTEL great for instrumenting my code to understand how long different parts of my code took, how often errors occur and how many requests I’m getting. You can use OTEL for LLM Observability; here’s an example. However, I chose logs because as noted in the next section they are easier to mine.
Aside: Structured Logging In Python
Python’s logging module supports structured logging. In Python you can use the extra argument to pass an arbitrary dictionary of values. In python the equivalent would be:
logger.info("OpenAI:CreateChatCompletion", extra={'request': request, "traceId": traceId})
You then configure the logging module to use the python-json-logger formatter to emit logs as JSON. Here’s the logging.conf I use for Python.
Logs Need To Be Mined
Post-processing your logs is often critical to unlocking the most valuable insights. In the context of Foyle, I want a record for each cell that captures how it was generated and any subsequent executions of that cell. To produce this, I need to write a simple ETL pipeline that does the following:
- Build a trace by grouping log entries by trace ID
- Reykey each trace by the cell id the trace is associated with
- Group traces by cell id
This logic is highly specific to Foyle. No observability tool will support it out of box.
Consequently, a key consideration for my observability backend is how easily it can be wired up to my preferred ETL tool. Logs processing is such a common use case that most existing logging providers likely have good support for exporting your logs. With Google Cloud Logging for example it’s easy to setup log sinks to route logs to GCS, BigQuery or PubSub for additional processing.
Visualization
The final piece is being able to easily visualize the traces to inspect what’s going on. Arguably, this is where you might expect LLM/AI focused tools might shine. Unfortunately, as the previous section illustrates, the primary way I want to view Foyle’s data is to look at the processing associated with a particular cell. This requires post-processing the raw logs. As a result, out of box visualizations won’t let me view the data in the most meaningful way.
To solve the visualization problem, I’ve built a lightweight progressive web app(PWA) in Go (code) using maxence-charriere/go-app. While I won’t be winning any design awards, it allows me to get the job done quickly and reuse existing libraries. For example, to render markdown as HTML I could reuse the Go libraries I was already using (yuin/goldmark). More importantly, I don’t have to wrestle with a stack(typescript, REACT, etc…) that I’m not proficient in. With Google Logs Analytics, I can query the logs using SQL. This makes it very easy to join and process a trace in the web app. This makes it possible to view traces in real-time without having to build and deploy a streaming pipeline.
Try Foyle
Please consider following the getting started guide to try out an early version of Foyle and share your thoughts by email(jeremy@lewi.us) on GitHub(jlewi/foyle) or on twitter (@jeremylewi)!
About Me
I’m a Machine Learning platform engineer with over 15 years of experience. I create platforms that facilitate the rapid deployment of AI into production. I worked on Google’s Vertex AI where I created Kubeflow, one of the most popular OSS frameworks for ML.
I’m open to new consulting work and other forms of advisory. If you need help with your project, send me a brief email at jeremy@lewi.us.
Acknowledgements
I really appreciate Hamel Husain and Joseph Gleasure reviewing and editing this post.